
In the realm of optical imaging systems, the accurate assessment of an instrument's resolving power is paramount. To meet this need, the United States Air Force (USAF) devised a pioneering tool in 1951 under the MIL-STD-150A standard: the 1951 USAF Resolution Test Chart. This microscopic optical resolution test device has since become a ubiquitous benchmark for evaluating the clarity and detail-capturing abilities of various imaging systems.
Origins and Purpose
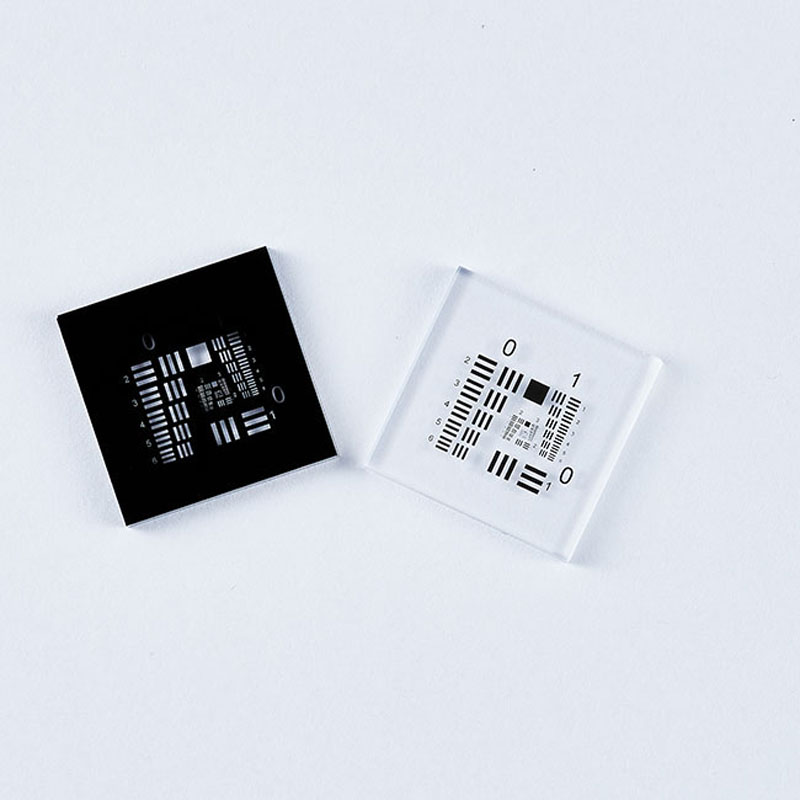
The 1951 USAF Resolution Test Chart was specifically designed to provide a standardized method for measuring the resolving power of optical systems. By displaying a meticulously crafted array of small target shapes, each exhibiting a graduated assortment of precise spatial frequency specimens, the chart enables precise quantification of an imaging system's ability to distinguish between closely spaced points or object details.
Design Features
The chart's design revolves around the concept of spatial frequency, which refers to the number of line pairs per millimeter (lp/mm) that can be resolved by an optical system. The chart comprises multiple "groups," each containing six "elements" arranged in a distinct pattern. These elements—consisting of horizontal and vertical lines—vary in size, with the largest group positioned at the periphery of the chart and progressively smaller groups moving towards the center. This stepped arrangement allows for the assessment of an imaging system's resolution at different levels of detail.
Applications
The 1951 USAF Resolution Test Chart has found widespread application across numerous industries. It is routinely employed in the testing and quality control of microscopes, cameras, lenses, image scanners, and other optical instruments. Its versatility extends to fields as diverse as aerospace, astronomy, and consumer electronics, where the ability to capture fine details is crucial.
Usage Guidelines
To use the 1951 USAF Resolution Test Chart, the chart is placed within the field of view of the imaging system being tested. By adjusting the system's settings to achieve a clear image, testers can identify the smallest elements on the chart that can be discerned with certainty. This threshold value is indicative of the system's resolving power and can be further analyzed using lookup tables or spatial resolution calculation formulas.
Advantages and Limitations
The chart's primary advantage lies in its standardization, ensuring that resolution measurements taken with different systems can be compared accurately. Furthermore, its simple yet effective design makes it easy to use and interpret. However, some modern optical systems may require more sophisticated analysis tools that go beyond the chart's discrete element arrangement. Additionally, environmental factors such as ambient lighting and lens distortions can introduce variability into test results.
The 1951 USAF Resolution Test Chart remains a vital tool in the evaluation of optical imaging systems' resolving power. Despite the advancements in optical technology, its standardized approach and straightforward design continue to make it a reliable and widely adopted benchmark. As the demand for higher-resolution imaging grows across various industries, the 1951 USAF Resolution Test Chart will undoubtedly continue to play a pivotal role in ensuring the quality and performance of optical systems worldwide.


 of ultra-high resolution test targets: a key verification standard for the true resolution capability of high-end lenses.")