The 1951 USAF (United States Air Force) Resolution Test Chart is a vital tool used in the field of optics and imaging to assess the resolving power of various imaging systems, including cameras, microscopes, telescopes, and even the human eye. This chart, designed by the USAF in 1951, has become an industry standard for measuring spatial resolution and is widely recognized for its accuracy and versatility. In this article, we will delve into the intricacies of reading and interpreting the 1951 USAF Resolution Test Chart.
Understanding the Basic Structure
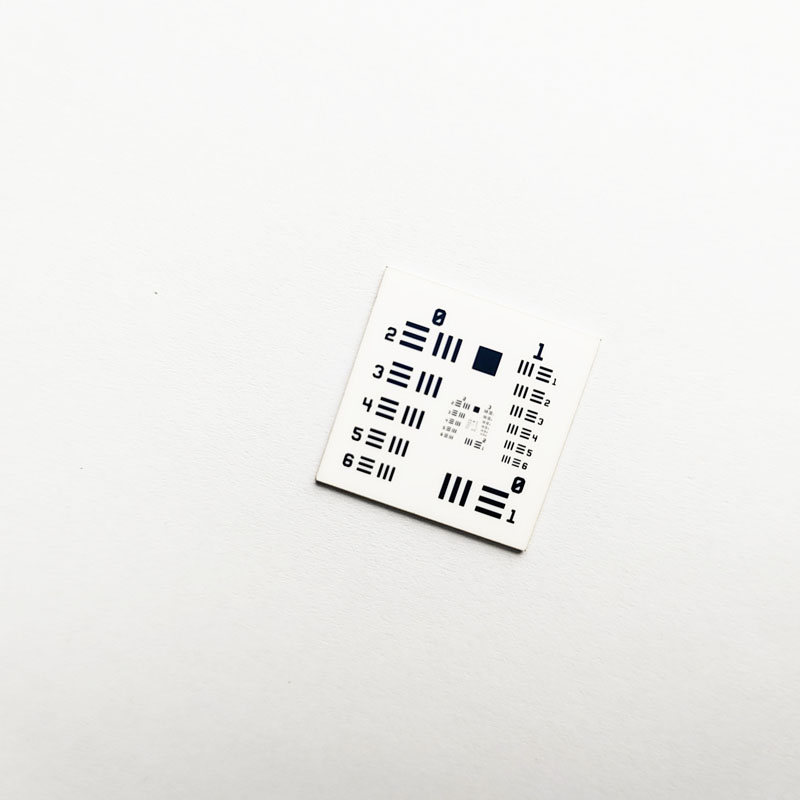
At the core of the 1951 USAF Resolution Test Chart lies its unique design, which consists of a series of "groups" and "elements." Each group comprises six elements, each element featuring a distinct pattern of horizontal and vertical bars. The group numbers are displayed at the top of each group, while the element numbers are located along the sides. For instance, in the top right corner, you'll find Group "-1" with elements 1 through 6.
Key Elements of the Chart
Groups and Elements: The chart is organized into groups, with each group containing six elements. These elements progress in difficulty from easy to challenging, with the smallest, most intricate patterns found towards the bottom of the chart.
Bar Patterns: Each element is characterized by a specific pattern of horizontal and vertical bars. These bars are designed to test the system's ability to distinguish between closely spaced lines.
Resolution Limit: The smallest element that can be clearly resolved by an imaging system indicates its resolution limit. This is a crucial metric for evaluating the performance of cameras, lenses, and other optical devices.
Reading the Chart
Identify the Groups and Elements: Begin by familiarizing yourself with the layout of the chart. Locate the group and element numbers to understand the structure and progression of difficulty.
Visual Inspection: Place the chart in front of the imaging system you wish to test. Slowly move the chart closer or further away from the system until you can clearly see the patterns within each element.
Determine the Resolution Limit: Start at the top of the chart and work your way down. Identify the smallest element that can be clearly distinguished by the imaging system. This element corresponds to the system's resolution limit.
Record Your Findings: Document the group and element number of the smallest clearly resolved pattern. This information can be used to compare the performance of different imaging systems or to track improvements over time.
Advanced Considerations
Contrast and Lighting: Ensure that the chart is properly illuminated and that the contrast is optimized for the imaging system being tested. Variations in lighting conditions can affect the results.
Magnification: Depending on the application, you may need to use a magnifying device to accurately assess the smallest elements. This is particularly important when testing high-resolution imaging systems.
Calibration: Regularly calibrate your imaging system and the chart to ensure consistent and accurate results.
The 1951 USAF Resolution Test Chart is a powerful tool for evaluating the resolving power of imaging systems. By understanding its structure and learning how to read it effectively, you can gain valuable insights into the performance of your cameras, lenses, and other optical devices. Whether you're a professional photographer, a scientist working in microscopy or astronomy, or simply someone interested in the world of optics, mastering the 1951 USAF Resolution Test Chart will undoubtedly enhance your understanding and appreciation of the intricacies of imaging technology.